Canvas Widgets
These widgets provide visual feedback to the user using the canvas.
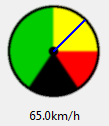
RotaryScale
-
class
canvas.RotaryScale(parent, max_value: (<class 'float'>, <class 'int'>) = 100.0, size: (<class 'float'>, <class 'int'>) = 100, unit: str = None, img_data: str = None, needle_color='blue', needle_thickness=0, **options)¶ Shows a rotary scale, much like a speedometer.:
rs = tk_tools.RotaryScale(root, max_value=100.0, size=100, unit='km/h')
rs.grid(row=0, column=0)

rs.set_value(10)
Parameters: - parent – tkinter parent frame
- max_value – the value corresponding to the maximum value on the scale
- size – the size in pixels
- options – the frame options
-
set_value(number: (<class 'float'>, <class 'int'>))¶ Sets the value of the graphic
Parameters: number – the number (must be between 0 and ‘max_range’ or the scale will peg the limits Returns: None
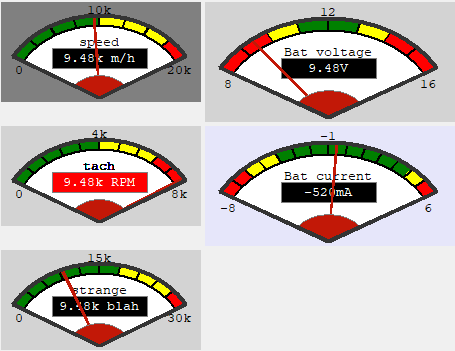
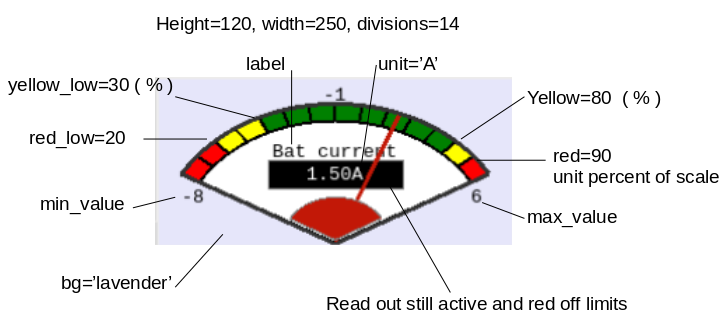
Gauge
-
class
canvas.Gauge(parent, width: int = 200, height: int = 100, min_value=0.0, max_value=100.0, label='', unit='', divisions=8, yellow=50, red=80, yellow_low=0, red_low=0, bg='lightgrey')¶ Shows a gauge, much like the RotaryGauge.:
gauge = tk_tools.Gauge(root, max_value=100.0,
                       label='speed', unit='km/h')
gauge.grid()
gauge.set_value(10)
Parameters: - parent – tkinter parent frame
- width – canvas width
- height – canvas height
- min_value – the minimum value
- max_value – the maximum value
- label – the label on the scale
- unit – the unit to show on the scale
- divisions – the number of divisions on the scale
- yellow – the beginning of the yellow (warning) zone in percent
- red – the beginning of the red (danger) zone in percent
- yellow_low – in percent warning for low values
- red_low – in percent if very low values are a danger
- bg – background
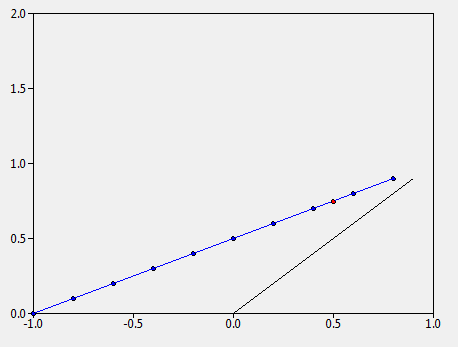
Graph
-
class
canvas.Graph(parent, x_min: float, x_max: float, y_min: float, y_max: float, x_tick: float, y_tick: float, **options)¶ Tkinter native graph (pretty basic, but doesn’t require heavy install).:
graph = tk_tools.Graph(
    parent=root,
    x_min=-1.0,
    x_max=1.0,
    y_min=0.0,
    y_max=2.0,
    x_tick=0.2,
    y_tick=0.2,
    width=500,
    height=400
)

graph.grid(row=0, column=0)

# create an initial line
line_0 = [(x/10, x/10) for x in range(10)]
graph.plot_line(line_0)
Parameters: - parent – the parent frame
- x_min – the x minimum
- x_max – the x maximum
- y_min – the y minimum
- y_max – the y maximum
- x_tick – the ‘tick’ on the x-axis
- y_tick – the ‘tick’ on the y-axis
- options – additional valid tkinter.canvas options
-
draw_axes()¶ Removes all existing series and re-draws the axes.
Returns: None
-
static
frange(start, stop, step, digits_to_round=3)¶ Works like range for doubles
Parameters: - start – starting value
- stop – ending value
- step – the increment_value
- digits_to_round – the digits to which to round (makes floating-point numbers much easier to work with)
Returns: generator
-
plot_line(points: list, color='black', point_visibility=False)¶ Plot a line of points
Parameters: - points – a list of tuples, each tuple containing an (x, y) point
- color – the color of the line
- point_visibility – True if the points should be individually visible
Returns: None
-
plot_point(x, y, visible=True, color='black', size=5)¶ Places a single point on the grid
Parameters: - x – the x coordinate
- y – the y coordinate
- visible – True if the individual point should be visible
- color – the color of the point
- size – the point size in pixels
Returns: The absolute coordinates as a tuple
LED
-
class
canvas.Led(parent, size: int = 100, on_click_callback: callable = None, toggle_on_click: bool = False, **options)¶ Create an LED-like interface for the user.:
led = tk_tools.Led(root, size=50)
led.pack()

led.to_red()
led.to_green(on=True)
The user also has the option of adding an on_click_callback function. When the button is clicked, the button will change state and the on-click callback will be executed. The callback must accept a single boolean parameter, on, which indicates if the LED was just turned on or off.
Parameters: - parent – the parent frame
- size – the size in pixels
- on_click_callback – a callback which accepts a boolean parameter ‘on’
- options – the frame options
-
to_green(on: bool = False)¶ Change the LED to green (on or off).
Parameters: on – True or False Returns: None
-
to_grey(on: bool = False)¶ Change the LED to grey.
Parameters: on – Unused, here for API consistency with the other states Returns: None
-
to_red(on: bool = False)¶ Change the LED to red (on or off) :param on: True or False :return: None
-
to_yellow(on: bool = False)¶ Change the LED to yellow (on or off) :param on: True or False :return: None